|
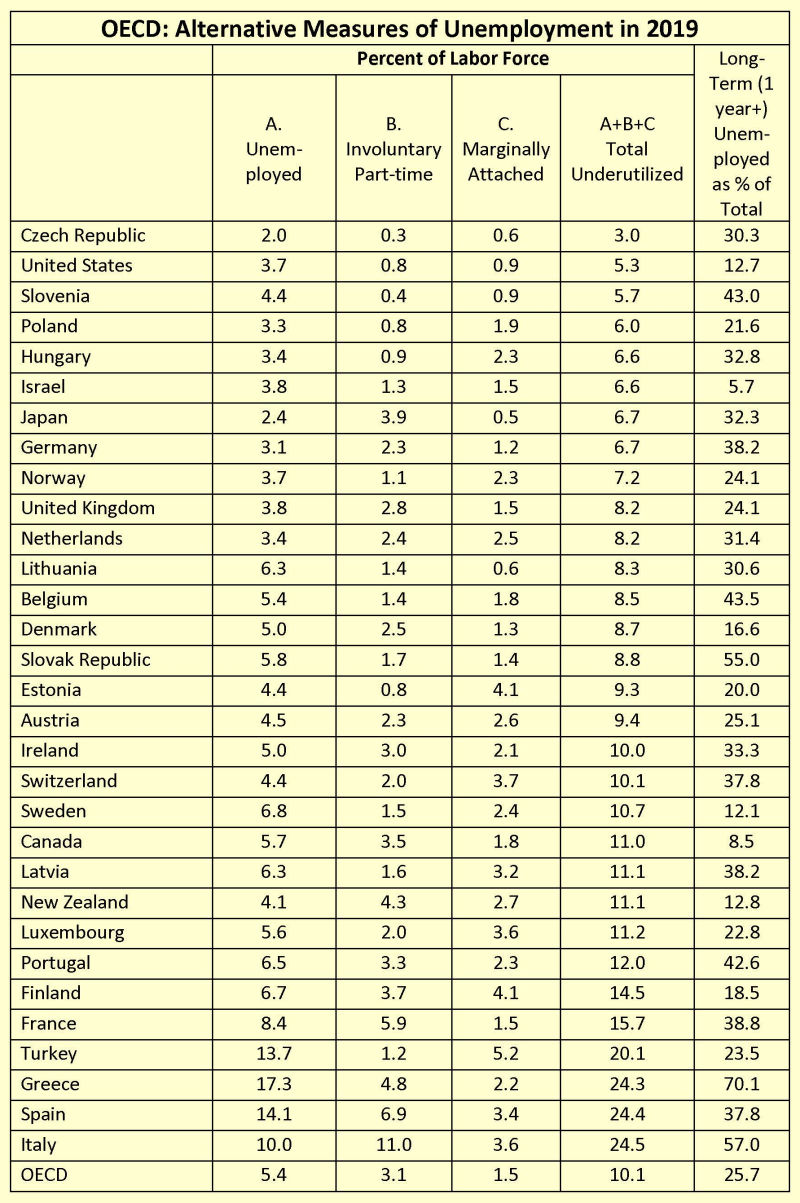
COMPARATIVE ECONOMIC STATISTICS: I. Unemployment A.
Despite International Labour Office conventions, differences
continue. See
this article and
this one from the U.S. Department
of Labor.
|
||||||||||||||||||||||||||||||||||||||||||||||||||||||||||||||||||||||||||||||||||||||||||||||||||||||||||||||||||||||||||||||||||||||||||||||||||||||||||||||||||||||||||||||||||||||||||||||||||||||||||||||||||||||||||||||||||||||||||||||||||||||||||||||||||||||||||||||||||||||||||||||||||||||||||||||||||||||||||||||||||||||||||||||||||||||||||||||||||||||||||||||||||||||||||||||||||||||||||||||||||||||||||||
|
|
12/2020 |
12/2021 |
12/2022
|
|
U-1 Persons unemployed 15 weeks or longer, as a percent of the civilian labor force |
3.4 |
1.7 |
1.1 |
|
U-2 Job losers and persons who completed temporary jobs, as % of the civilian labor force |
4.5 |
1.9 |
1.6 |
|
U-3 Total unemployed, as a percent of the civilian labor force (official unemployment rate) |
6.7 |
3.9 |
3.5 |
|
U-4 Total unemployed plus discouraged workers, as a percent of the civilian labor force plus discouraged workers |
7.1 |
4.2 |
3.7 |
|
U-5 Total unemployed, plus discouraged workers, plus all other marginally attached workers, as a percent of the civilian labor force plus all marginally attached workers |
7.9 |
4.9 |
4.2 |
|
U-6 Total unemployed, plus all marginally attached workers, plus total employed part time for economic reasons, as a percent of the civilian labor force plus all marginally attached workers |
11.7 |
7.3 |
6.5 |
Source: U.S. Bureau of Labor Statistics http://www.bls.gov/news.release/empsit.t15.htm

Source: http://stats.oecd.org
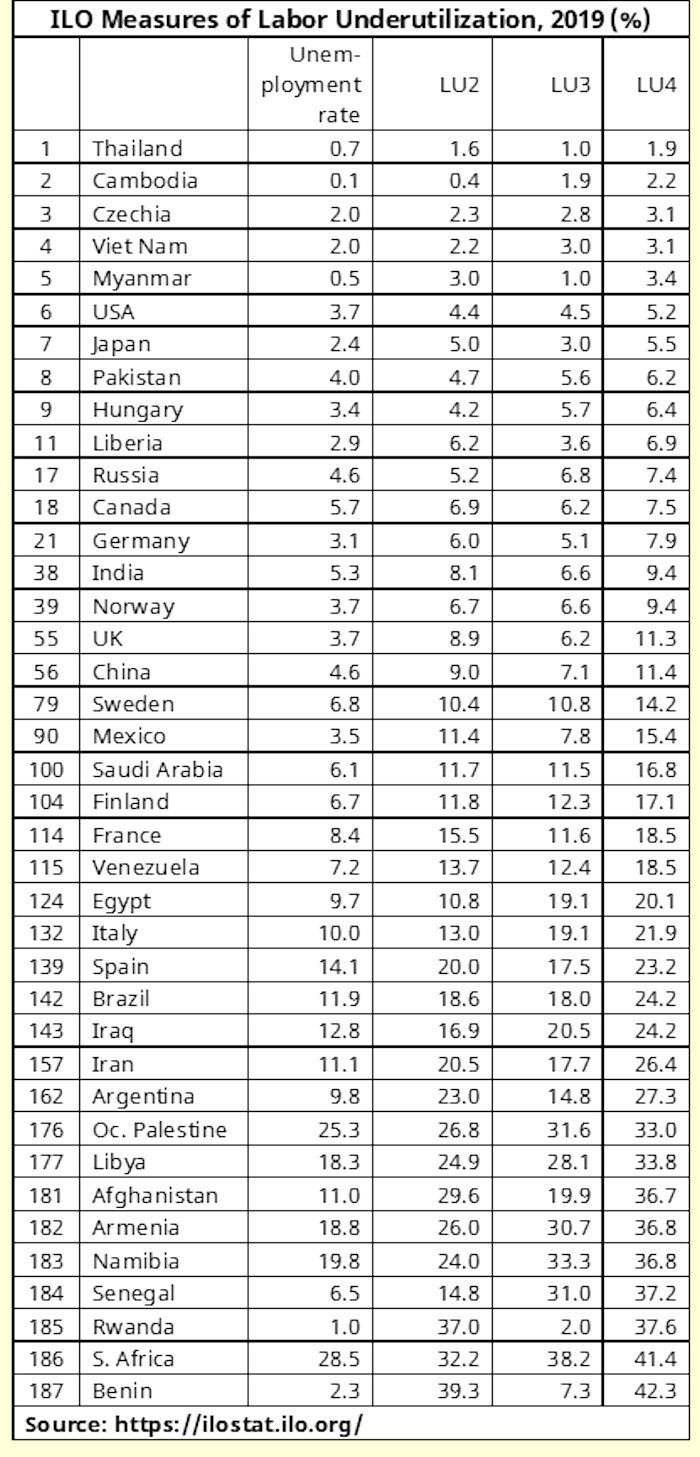
D. International
Labor Office (ILO) expanded measures of labor
underutilization.
LU1: Unemployment rate
- Follows the standard concepts mentioned above, but ILO
data for many developing countries are based on a
combination of survey data, employment office registrations,
and statistical modeling.
LU2: Takes into
account unemployment and involuntary part-time work
Combined rate of time-related underemployment and
unemployment
[(persons in time-related underemployment + persons in
unemployment) / labour force] x 100
LU3: Takes into account unemployment
and "potential labor" that may be "marginally attached" and
"discouraged"
Combined rate of unemployment and potential labour force
[(persons in unemployment + potential labour force) /
(extended labour force)] x 100
LU4: Takes all of the above into
account
Aggregate measure of labour underutilization
[(persons in time-related underemployment + persons in
unemployment + potential labour force) / (extended labour
force)] x 100

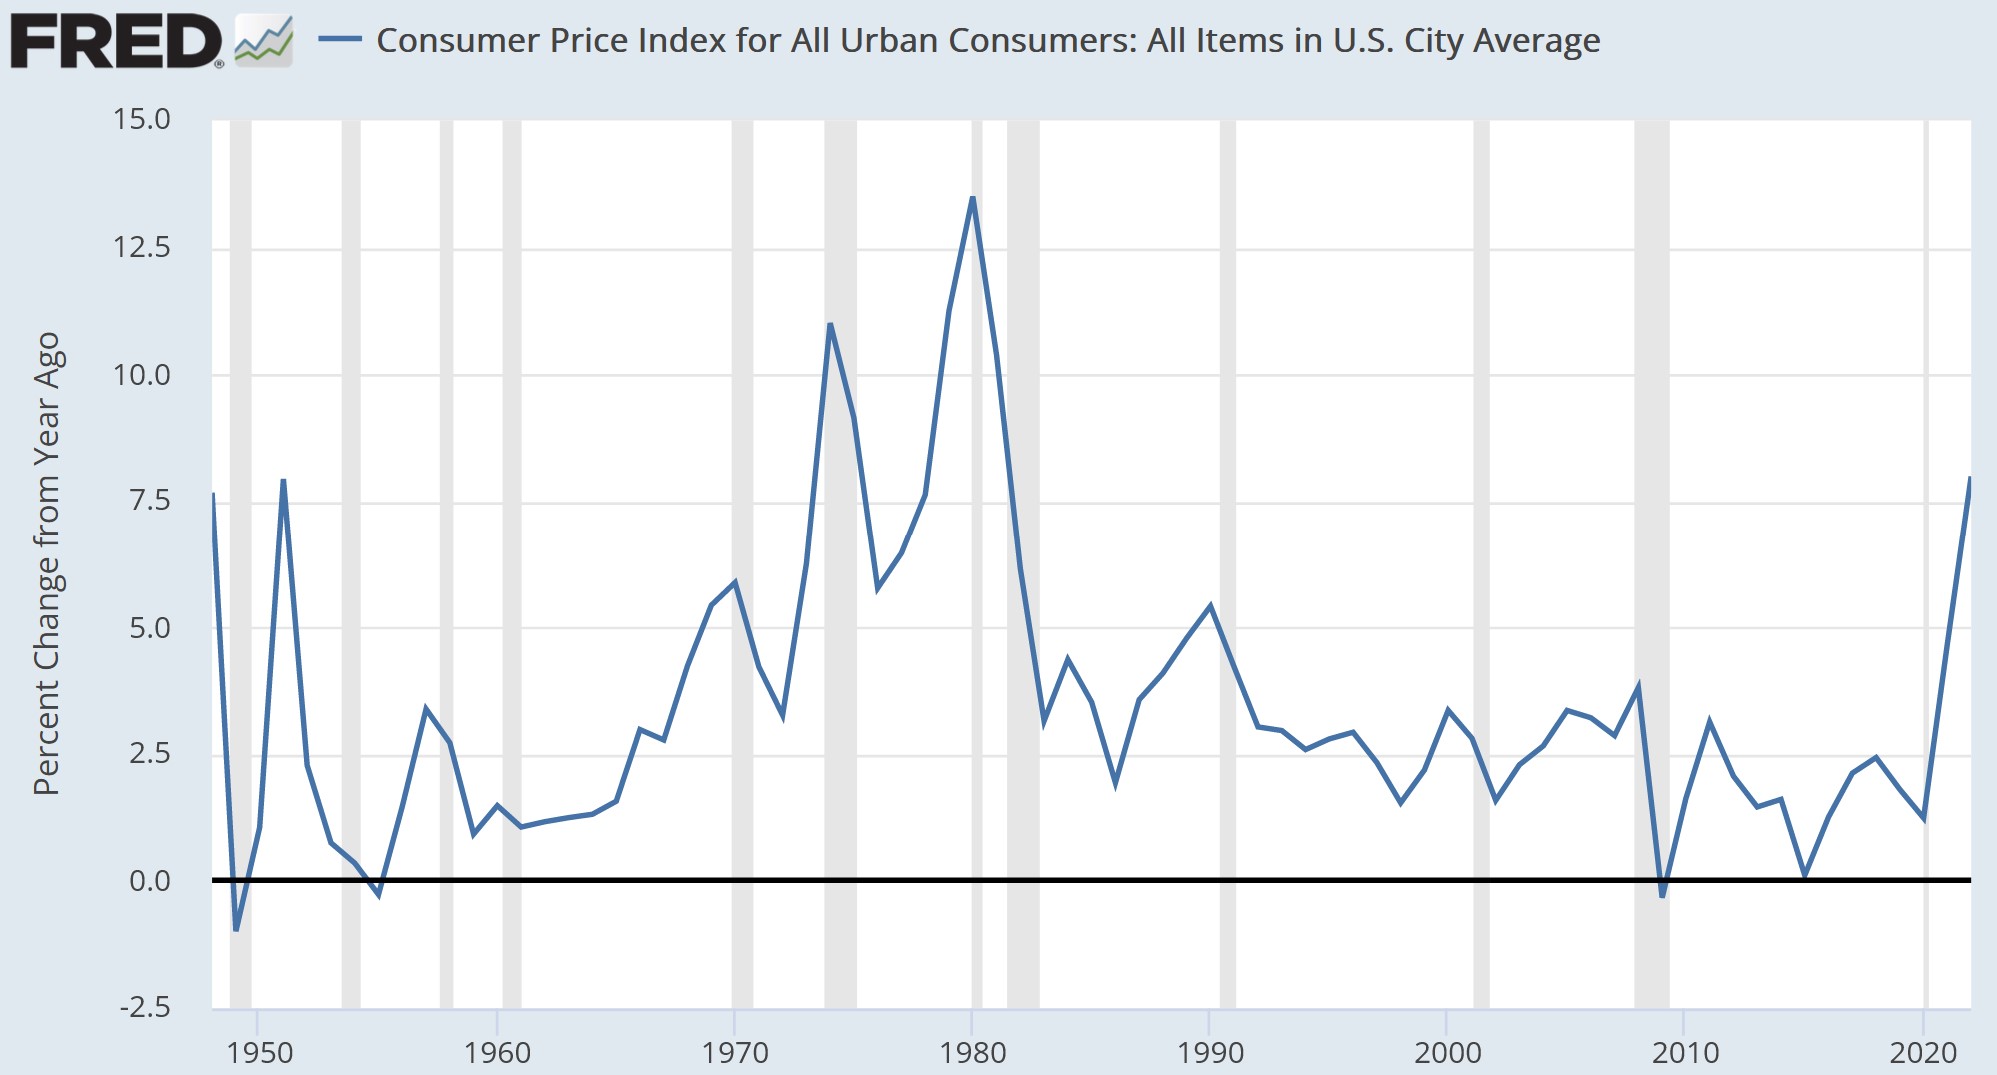
II. Inflation

A. Data Collection: Price indexes vary across countries in the quality and quantity of data collected.
1. Price surveys in market economies
2. Comprehensive price lists were used in centrally planned economies
B.
Base Years and Chaining: Laspeyres (early base
year quantity weights), Paasche (current year weights),
Fisher (geometric average of Laspeyres and Paasche), and
Chained Price Indexes handle quantity
weights differently.
Generally speaking, a Laspeyres index tends to overestimate
the rate of inflation (especially in a country experiencing
structural change and if the weights are not changed
frequently) and a Paasche tends to underestimate inflation.
A Fisher Ideal index is more complicated to compute, but is
designed to reduce those biases.
The U.S. has moved to Fisher Chained indexes for GDP deflators
(Paashe before 1996), but the CPI
is still a chained Laspeyres. In early years, the
weights were held constant for ten years. Starting in
2002, they were changed every two years, based on a
previous two-year average of consumption weights. Starting
now (January 2023), the weights will be changed every
January, based on a single-year survey of weights. So
inflation in 2023 will be based on consumer expenditure
weights in 2021. That makes the U.S. CPI more compatible
with the EU Harmonized
Indices of Consumer Prices which
are also chained Laspeyres indices with the weights
updated each January.
C. Quality Adjustment—If product quality improvements are not taken into account, the price index will overestimate the rate of inflation.
1. Direct
adjustment - adjust food items for change in
package size, adjust cars for change in standard
equipment. In the U.S., mandated pollution control
measures were counted as quality adjustments between 1971
and 1999, but since the beginning of 1999 they have NOT been
counted as quality improvements. See
this page on changes in policy.
2. Matched Models - limit sample to matching products, rather than price per unit for full sample.
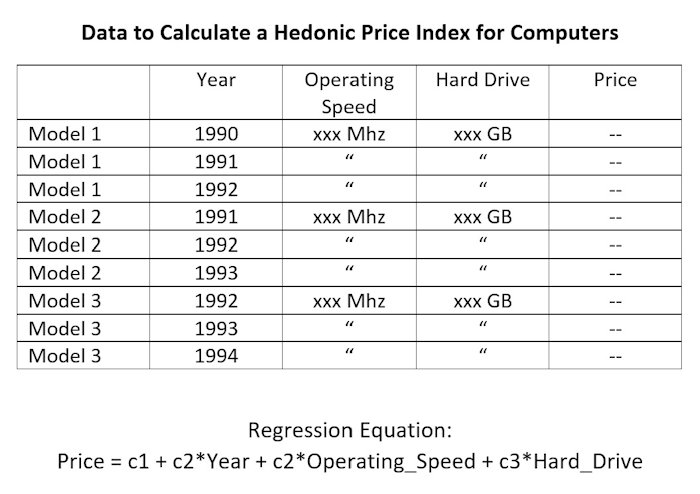
3. Hedonic
Method - statistical technique to find out
how much price has changed after allowance has been made for
a number of operating characteristics. In U.S., they
are now used in computers (in the PPI since 1991 and in the
CPI since 1998), televisions (in the CPI since 1999),
appliances (CPI 2000), and a growing number of other
products. See
example here for cell phones.

D. Countries that exercise price controls experience:
1. Open, reported inflation - Occurs because not all prices are controlled or because planners increase prices.
2. Hidden inflation - Monetary price increases, but not measured.
a. Hidden transactions - black market or "under the table"
b. Hidden quality deterioration, false quality improvement, or forced substitution of high-quality for low-quality products
3. Repressed inflation - Occurs when price controls are effective, and inflationary pressure causes shortages or queues.
|
Consumer Price Inflation Rates |
|||||||
|
1960s |
1970s |
1980s |
1990s |
2000s |
2010s |
2021 |
|
|
East Asia & Pacific |
4.6 |
3.5 |
2.2 |
2.5 |
|||
|
China |
7.5 |
2.2 |
2.5 |
1.0 |
|||
|
Indonesia |
210.6 |
17.5 |
8.6 |
14.9 |
8.6 |
4.4 |
1.6 |
|
Japan |
5.6 |
9.1 |
2.1 |
1.1 |
-0.3 |
0.5 |
-0.2 |
|
Korea, Rep. |
14.0 |
16.5 |
6.4 |
6.0 |
3.2 |
1.5 |
2.5 |
|
Central Eurasia (start 1993) |
7.5 |
3.1 |
1.7 |
3.2 |
|||
|
Belarus |
596.6 |
21.1 |
19.6 |
9.5 |
|||
|
Czechia |
9.2 |
2.6 |
1.9 |
3.8 |
|||
|
Hungary |
10.9 |
23.2 |
5.6 |
2.3 |
5.1 |
||
|
Poland |
|
4.7 |
108.9 |
85.2 |
2.8 |
1.7 |
5.1 |
|
Russia |
197.0 |
12.6 |
6.5 |
6.7 |
|||
|
Ukraine |
770.1 |
11.3 |
11.9 |
9.4 |
|||
|
W. Europe |
3.1 |
9.5 |
5.8 |
3.7 |
2.3 |
1.2 |
2.4 |
|
France |
4.0 |
9.7 |
6.3 |
2.0 |
1.7 |
1.0 |
1.6 |
|
Germany |
2.6 |
5.1 |
2.6 |
2.7 |
1.6 |
1.3 |
3.1 |
|
Norway |
4.5 |
8.4 |
7.7 |
2.8 |
2.0 |
2.0 |
3.5 |
|
United Kingdom |
4.1 |
13.8 |
6.2 |
3.7 |
2.1 |
1.9 |
2.5 |
|
Sub-Saharan Africa |
9.5 |
10.4 |
6.1 |
4.6 |
4.6 |
||
|
Congo, Dem. Rep. |
|
44.1 |
60.4 |
3418.6 |
48.7 |
10.3 |
9.0 |
|
Ethiopia |
|
9.9 |
4.7 |
7.6 |
11.0 |
14.8 |
26.8 |
|
Nigeria |
4.3 |
15.4 |
20.6 |
31.3 |
13.0 |
11.8 |
17.0 |
|
South Africa |
2.9 |
10.7 |
14.7 |
10.4 |
5.3 |
5.1 |
4.6 |
|
Latin America & Carib. |
|
12.9 |
11.9 |
11.1 |
4.3 |
2.6 |
3.9 |
|
Bolivia |
5.6 |
20.2 |
1380.1 |
10.9 |
4.9 |
4.1 |
0.7 |
|
Brazil |
613.8 |
844.0 |
6.7 |
5.6 |
8.3 |
||
|
Chile |
|
174.3 |
20.5 |
12.1 |
3.1 |
3.1 |
4.5 |
|
Mexico |
2.7 |
16.8 |
69.1 |
21.4 |
4.7 |
3.9 |
5.7 |
|
Venezuela, RB |
25.0 |
49.1 |
22.2 |
8860.0 |
1588.5 |
||
|
Middle East & N. Africa |
|
9.2 |
6.7 |
6.0 |
3.7 |
2.2 |
2.7 |
|
Egypt, Arab Rep. |
3.2 |
9.5 |
17.0 |
10.8 |
8.4 |
11.9 |
5.2 |
|
Iran, Islamic Rep. |
1.7 |
12.9 |
18.5 |
25.2 |
14.7 |
22.3 |
43.4 |
|
Israel |
5.6 |
45.0 |
118.6 |
11.4 |
2.2 |
0.7 |
1.5 |
|
South Asia |
|
8.9 |
9.1 |
9.5 |
5.9 |
6.0 |
5.5 |
|
India |
6.3 |
8.2 |
9.0 |
9.9 |
6.3 |
6.3 |
5.1 |
|
Pakistan |
3.5 |
12.4 |
7.0 |
10.2 |
8.8 |
7.2 |
9.5 |
|
United States |
2.8 |
7.9 |
4.7 |
3.3 |
2.4 |
1.7 |
4.7 |
|
World |
8.0 |
7.5 |
4.2 |
2.5 |
3.5 |
||
|
Sources: World Bank and IMF |
|||||||