|
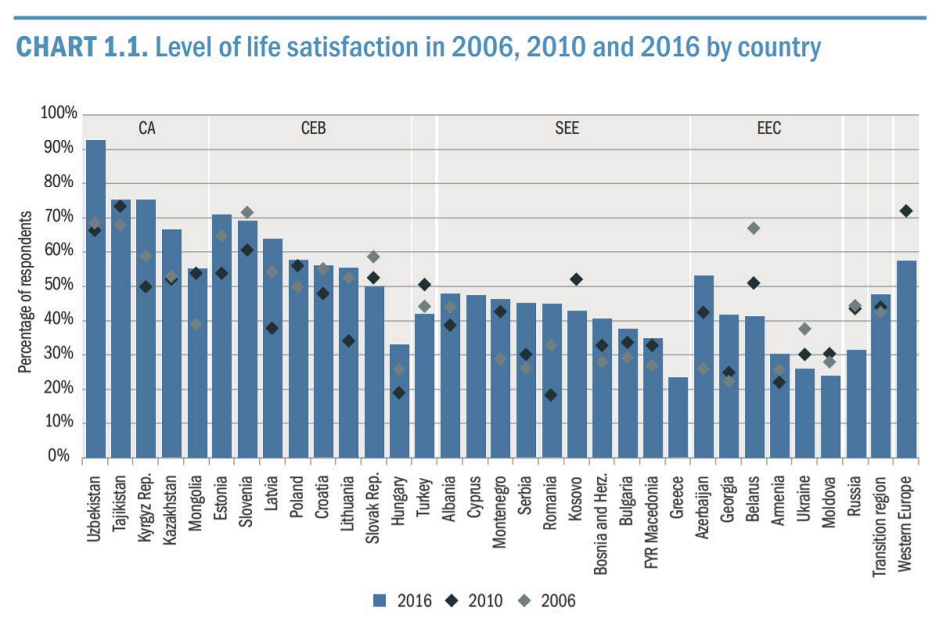
Central Eurasia: Making Markets Another look at the map
 Source: World Bank, World Development Indicators
|
||||||||||||||||||||||||||||||||||||||||||||||||||||||||||||||||||||||||||||||||||||||||||||||||||||||||||||||||||||||||||||||||||||||||||||||||||||||||||||||||||||||||||||||||||||||||||||||||||||||||||||||||||||||||||||||||||||||||||||||||||||||||||||||||||||||||||||||||||||||||||||||||||||||||||||||||||||||||||||||||||||||||||||||||||||||||||||||||||||||||||||||||||||||||||||||||||||||||||||||||||||||||||||||||||||||||||||||||||||||||||||||||||||||||||||||||||||||||||||||||||||||||||||||||||||||||||||||||||||||||||||||||||||||||||||||||||||||||||||||||||||||||||||||||||||||||||||||||||||||||||||||||||||||||||||||||||

|
1989 |
1995 |
2000 |
2005 |
2010 |
|
|
Albania |
5 |
60 |
75 |
75 |
75 |
|
Armenia |
10 |
45 |
60 |
75 |
75 |
|
Azerbaijan |
10 |
25 |
45 |
60 |
75 |
|
Belarus |
5 |
15 |
20 |
25 |
30 |
|
Bosnia/Hrz |
na |
na |
35 |
55 |
60 |
|
Bulgaria |
10 |
50 |
70 |
75 |
75 |
|
Croatia |
15 |
40 |
60 |
65 |
70 |
|
Czech Rep. |
5 |
70 |
80 |
80 |
80 |
|
Estonia |
10 |
65 |
75 |
80 |
80 |
|
Macedonia |
15 |
40 |
55 |
65 |
70 |
|
Georgia |
10 |
30 |
60 |
65 |
75 |
|
Hungary |
5 |
60 |
80 |
80 |
80 |
|
Kazakhstan |
5 |
25 |
60 |
65 |
65 |
|
Kirgiz Rep. |
5 |
40 |
60 |
75 |
75 |
|
Latvia |
10 |
55 |
65 |
70 |
70 |
|
Lithuania |
10 |
65 |
70 |
75 |
75 |
|
Moldova |
10 |
30 |
50 |
60 |
65 |
|
Mongolia |
0 |
40 |
60 |
70 |
75 |
|
Montenegro |
na |
na |
na |
na |
65 |
|
Poland |
30 |
60 |
70 |
75 |
75 |
|
Romania |
15 |
45 |
60 |
70 |
70 |
|
Russia |
5 |
55 |
70 |
65 |
65 |
|
Serbia |
na |
na |
na |
na |
60 |
|
Slovakia |
5 |
60 |
80 |
80 |
80 |
|
Slovenia |
10 |
50 |
65 |
65 |
70 |
|
Tajikistan |
10 |
25 |
40 |
55 |
55 |
|
Turkmenistan |
10 |
15 |
25 |
25 |
25 |
|
Ukraine |
10 |
45 |
60 |
65 |
60 |
|
Uzbekistan |
10 |
30 |
45 |
45 |
45 |


EBRD Assessment of Transition Quality (AQP) Indicators
see explanations of terms here
|
Competitive |
Well-governed |
Green |
Inclusive |
Resilient |
Integrated |
|
|
|
2019 |
2019 |
2019 |
2019 |
2019 |
2019 |
|
Estonia |
7.63 |
8.27 |
6.42 |
7.66 |
8.11 |
7.49 |
|
Slovenia |
7.09 |
6.65 |
7.08 |
7.35 |
7.73 |
7.14 |
|
Poland |
6.76 |
6.82 |
6.52 |
6.81 |
7.86 |
6.81 |
|
Slovak Republic |
6.76 |
6.21 |
6.87 |
6.54 |
7.97 |
7.10 |
|
Cyprus |
6.68 |
7.07 |
6.32 |
6.66 |
5.60 |
7.68 |
|
Latvia |
6.48 |
6.66 |
6.77 |
7.07 |
7.89 |
7.00 |
|
Hungary |
6.36 |
6.01 |
6.27 |
6.65 |
7.15 |
6.84 |
|
Lithuania |
6.27 |
6.85 |
6.63 |
6.94 |
7.34 |
7.05 |
|
North Macedonia |
6.02 |
5.57 |
5.16 |
5.90 |
5.93 |
5.75 |
|
Romania |
6.01 |
6.04 |
6.14 |
5.74 |
7.11 |
6.75 |
|
Russia |
5.83 |
5.90 |
5.09 |
6.83 |
6.42 |
5.00 |
|
Greece |
5.78 |
5.22 |
6.13 |
6.24 |
7.04 |
6.41 |
|
Bulgaria |
5.71 |
5.79 |
6.04 |
6.24 |
6.91 |
6.85 |
|
Croatia |
5.64 |
5.97 |
6.38 |
6.39 |
7.47 |
6.54 |
|
Montenegro |
5.44 |
6.11 |
5.41 |
5.98 |
6.44 |
6.15 |
|
Serbia |
5.36 |
5.52 |
5.79 |
6.16 |
5.86 |
5.99 |
|
Kazakhstan |
5.26 |
5.67 |
5.36 |
6.46 |
5.95 |
4.91 |
|
Belarus |
5.17 |
5.15 |
6.22 |
6.63 |
4.16 |
5.43 |
|
Albania |
5.14 |
5.11 |
4.49 |
5.31 |
5.22 |
5.66 |
|
Georgia |
4.98 |
6.40 |
5.32 |
5.14 |
6.19 |
6.35 |
|
Armenia |
4.97 |
5.78 |
5.72 |
5.97 |
6.40 |
5.45 |
|
Kosovo |
4.78 |
4.56 |
3.47 |
5.28 |
5.18 |
4.67 |
|
Ukraine |
4.77 |
4.78 |
5.87 |
6.21 |
5.67 |
4.75 |
|
Bosnia/Herzegovina |
4.68 |
4.53 |
5.20 |
5.48 |
5.91 |
5.08 |
|
Azerbaijan |
4.39 |
5.79 |
5.35 |
4.94 |
3.97 |
5.59 |
|
Moldova |
4.36 |
4.81 |
4.68 |
5.58 |
5.82 |
4.94 |
|
Mongolia |
4.22 |
5.11 |
5.36 |
5.19 |
5.37 |
4.53 |
|
Kyrgyz Republic |
4.04 |
4.12 |
4.48 |
4.62 |
5.12 |
4.92 |
|
Uzbekistan |
3.39 |
4.45 |
4.41 |
5.41 |
3.96 |
3.93 |
|
Tajikistan |
3.25 |
3.63 |
4.84 |
5.05 |
3.68 |
3.51 |
|
Turkmenistan |
2.81 |
2.28 |
4.09 |
5.41 |
3.21 |
3.97 |
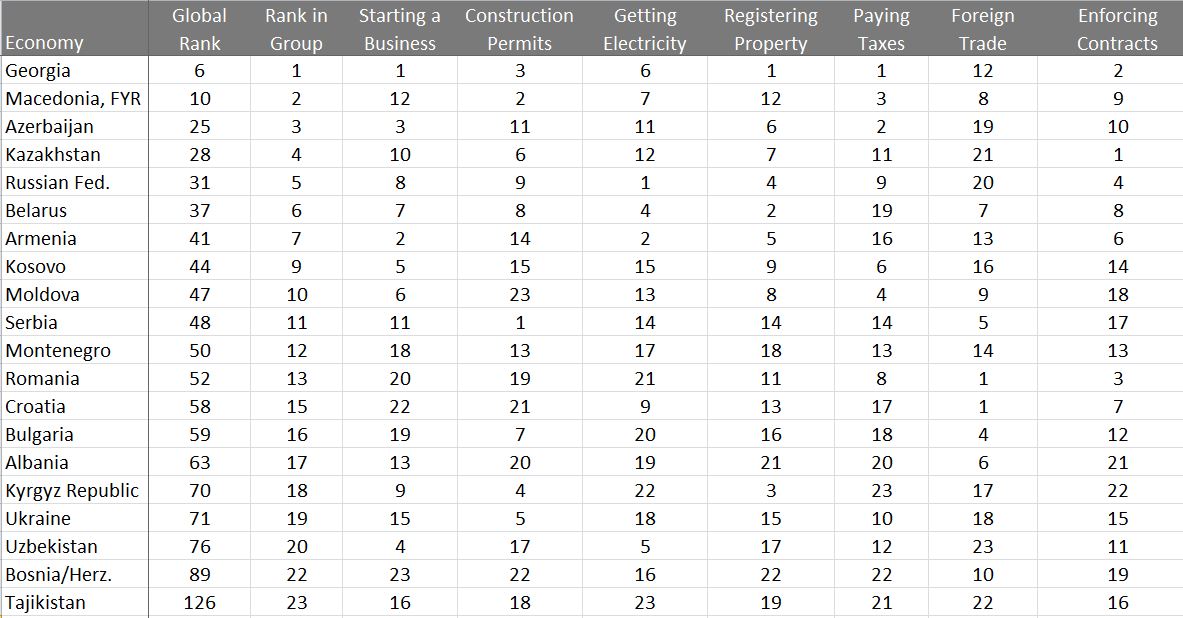
Ease of Doing Business Rankings, 2019
The World Bank, doingbusiness.org