COMPARATIVE ECONOMIC STATISTICS:
INCOME DISTRIBUTION AND POVERTY

I.      Income Distribution Comparisons--equality versus equity

A.      Measures of Income Inequality

1.      Decile ratio - the share of income received by the richest tenth of the population divided by the share received by the poorest tenth.

2.      Lorenz Curves - Illustrates the percentage of income received by cumulative percentages of the population. (See this web site).

3.      Gini ratio - Equal to the measured area between the diagonal line of equality and the Lorenz curve, divided by the area of the triangle under the line of equality.

4.      Poverty rate - The percentage of the population living below a level of income that provides for basic needs

B.      Problems in Making Income Distribution Comparisons -

1.      Coverage of the population - data that cover only employed persons or workers will indicate greater equality than data that include retired persons or the unemployed

2.      Segmentation of the population - Distribution of income among households can be different from the distribution of income among families or individuals.

3.      Definition of income -  Only wages? Capital gains? Before or after taxes?  Including transfers?  Based on consumption patterns rather than income?

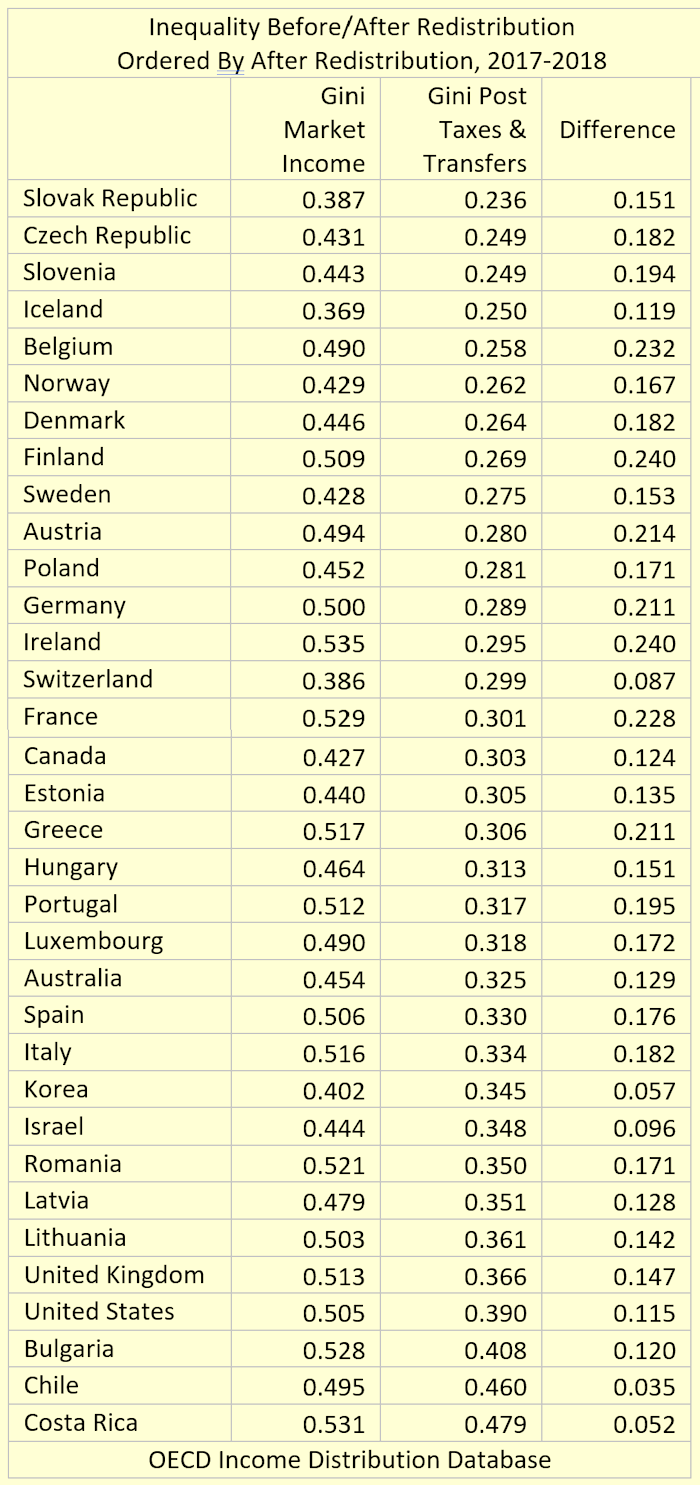
C.      Luxembourg Income Study and OECD Income Distribution Database - National reporting of income and wealth data make it possible to make comparisons with consistent definitions and coverage and to explore the impact of taxation and social expenditure policies.


Inequality Indices in 2010 Based on the
Luxembourg Income Study Database
(ordered by Gini Ratio)


Gini Coefficient

Percentile Ratio (90/10)

Relative Poverty Rate (50%)

Norway

0.243

2.9

7.4

Iceland

0.245

2.8

6.1

Denmark

0.248

2.9

6.3

Slovenia

0.252

3.3

9.8

Czech Republic

0.256

3.1

6.3

Netherlands

0.257

3.0

5.2

Finland

0.261

3.2

7.2

Slovakia

0.263

3.3

8.0

Luxembourg

0.269

3.3

6.1

Hungary

0.278

3.5

7.9

Germany

0.286

3.6

9.5

France

0.289

3.6

9.1

Ireland

0.294

3.8

9.4

Poland

0.310

3.9

9.6

Canada

0.317

4.2

12.5

Taiwan

0.317

4.4

11.8

Serbia

0.324

4.9

14.6

Estonia

0.325

4.5

11.8

Italy

0.327

4.4

12.5

Australia

0.330

4.5

13.9

Greece

0.333

4.4

13.5

Spain

0.333

5.1

15.2

UK

0.335

4.2

9.8

Russia

0.338

4.7

12.5

USA

0.367

5.7

16.9

Israel

0.377

6.1

20.3

Uruguay

0.405

6.2

15.2

Georgia

0.437

8.2

19.5

Mexico

0.455

9.0

20.1

Brazil

0.460

8.4

19.7

Peru

0.470

13.9

25.3

Panama

0.471

11.0

23.1

Colombia

0.482

10.0

19.6

South Africa

0.585

22.6

25.7


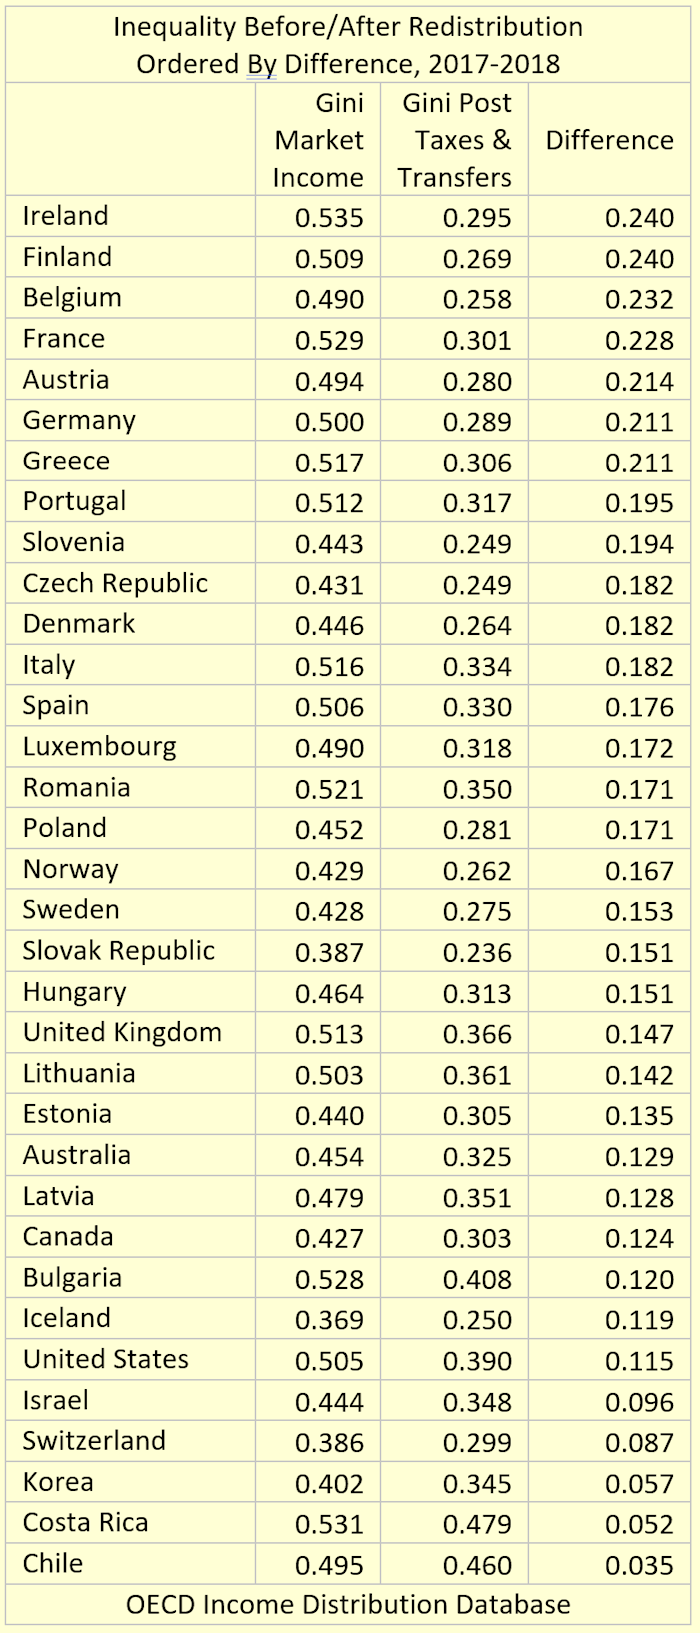
Ginis Pre and Post Government


Ginis Pre Post Govnment 2

Gini Ratios 2016-2018 (%)
World Bank

Czech Republic

24.9

Belarus

25.2

Ukraine

26.1

Norway

27

Kyrgyz Republic

27.7

Netherlands

28.5

Denmark

28.7

Sweden

28.8

Poland

29.7

Estonia

30.4

France

31.6

Germany

31.9

Canada

33.3

Armenia

34.4

Nigeria

35.1

Sierra Leone

35.7

Vietnam

35.7

Georgia

36.4

Thailand

36.4

Russian Federation

37.5

Indonesia

37.8

China

38.5*

El Salvador

38.6

Uruguay

39.7

Iran, Islamic Rep.

40.8

United States

41.1

Argentina

41.4

Turkey

41.9

Bolivia

42.2

Peru

42.8

Uganda

42.8

Dominican Republic

43.7

Zimbabwe

44.3

Chile

44.4

Lesotho

44.9

Ecuador

45.4

Mexico

45.4

Paraguay

46.2

Costa Rica

48

Colombia

50.4

Angola

51.3

Honduras

52.1

Brazil

53.9

 These are World Bank estimates.  According to estimates in the article, "Income Inequality in Today’s China," by Yu Xie and Xiang Zhou in PNAS, April 28, 2014, the Gini ratio for China is much higher - about 52%.
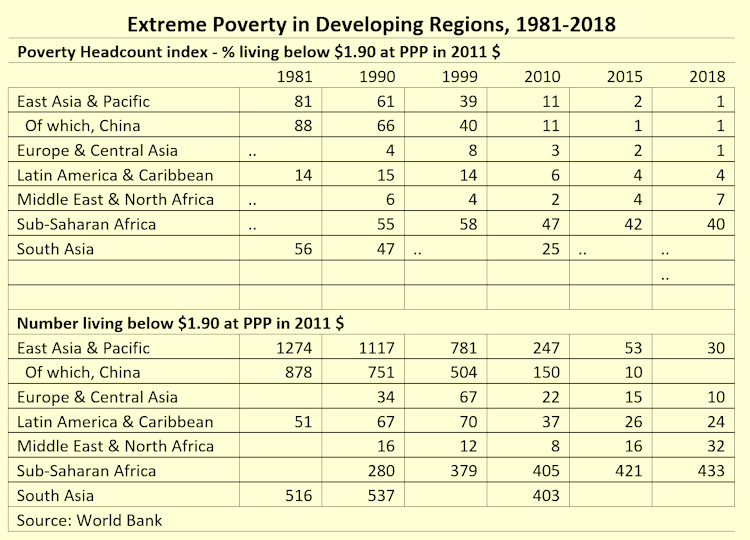
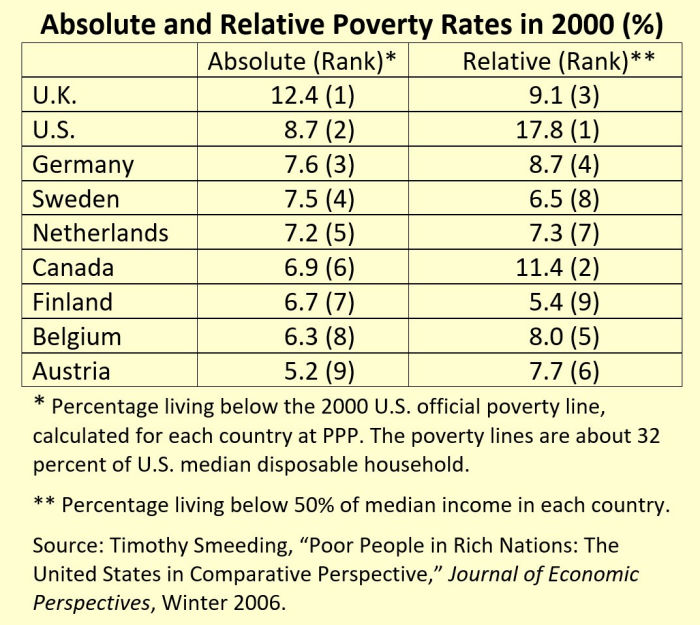
Absolute and Relative Poverty


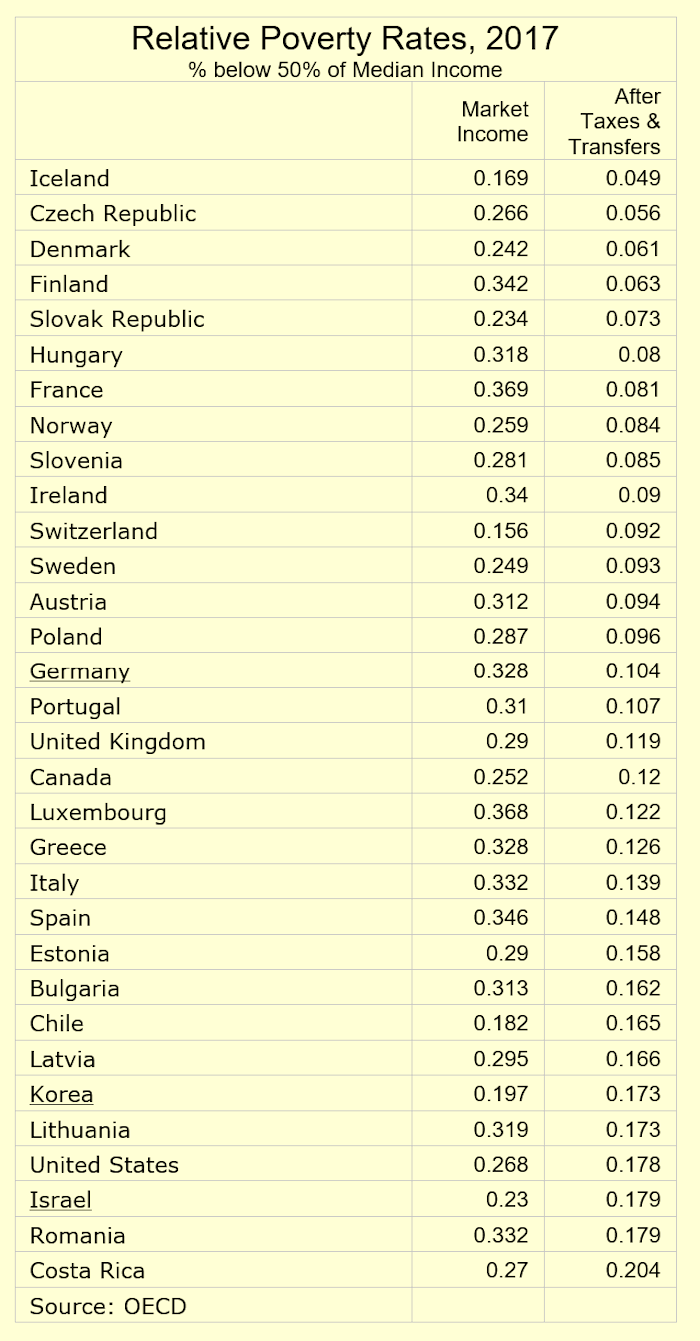
Relative Poverty 2017


Extreme Poverty 2018

World Bank projections indicate that the gains of recent decades are being reversed strongly by the COVID-19 pandemic.


II.      Wealth Distribution Comparisons

A.     Generally much more unequal than income because wealth is cumulative.

B.     Data sources - Data are available for a much smaller number of countries than income, because many countries have income taxes and income surveys, but fewer have wealth taxes and surveys. OECD issued a set of Guidelines for micro statistics on household wealth in 2013, and the Luxembourg Income Study was expanded to include wealth surveys, so more data have become available in very recent years.

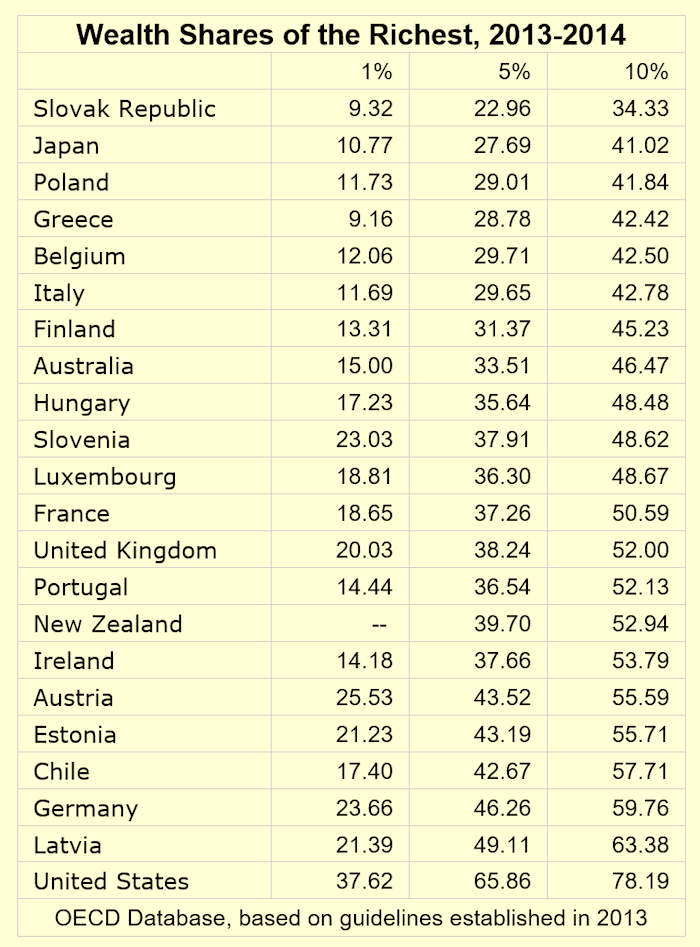
Wealth Distributions